
Designer sketches image ideas from sentences at a creative workspace

Master Visual Storytelling from Sentences
September 15, 20263 min read

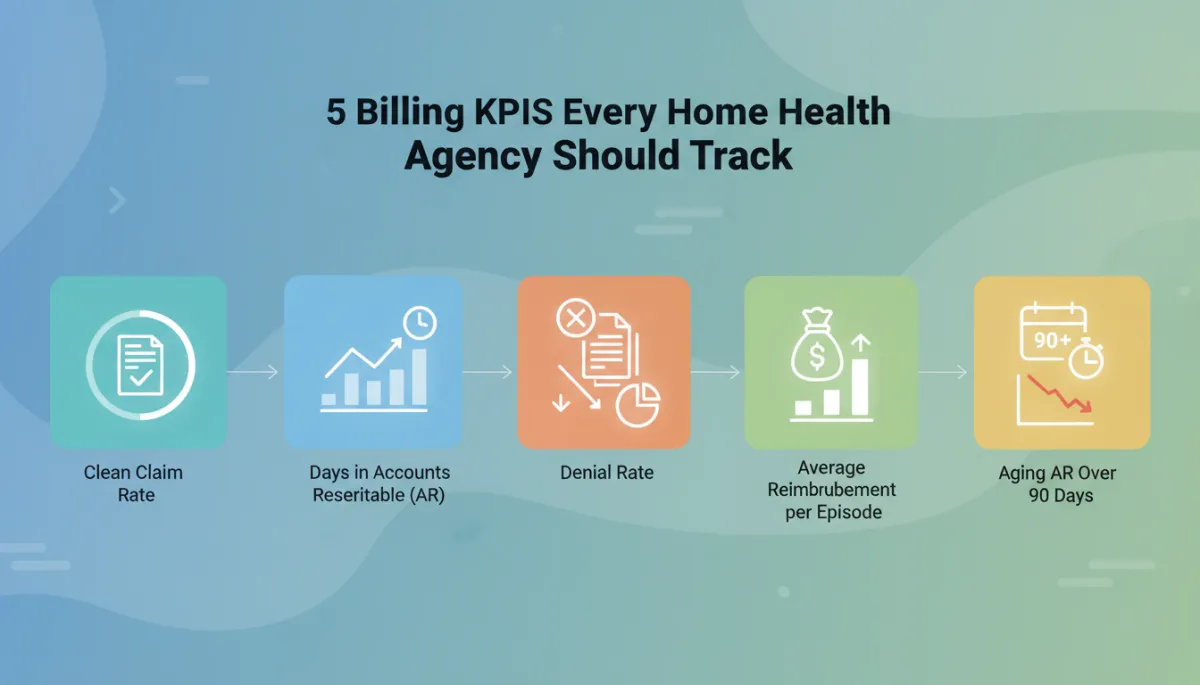
create an image / picture for this: 5 Billing KPIs Every Home Health Agency Should Track

Most home health agencies know their revenue matters — but far fewer track the specific billing KPIs that explain why revenue is higher or lower than expected. These metrics turn a vague sense of “cash flow feels tight” into something you can actually diagnose, monitor, and fix.

1. Clean Claim Rate

Clean claim rate is the percentage of claims that are accepted and paid on the first submission, with no rejections, edits, or corrections required. A healthy clean claim rate is typically above 90%.

If your rate is lower, it usually points to upstream problems such as incomplete documentation, missing authorizations, or coding errors — not just a billing department issue. Improving this metric puts cash in the door faster and reduces rework for your team.

2. Days in Accounts Receivable (AR)

Days in AR measures how long, on average, it takes to collect payment after a claim is submitted. Think of it as the “speed” of your revenue cycle.

When days in AR starts creeping up, it is often the earliest warning sign of a billing bottleneck — long before it shows up as a cash shortage. Watching this trend monthly helps you spot payer delays, follow-up gaps, or process slowdowns early.

3. Denial Rate

Denial rate is the percentage of claims that are denied on first submission. For home health agencies, a denial rate consistently above 5–10% deserves a closer look.

The real power comes from breaking denials down by reason and by payer. If most denials trace back to one insurer, one discipline, or one documentation gap, you are looking at a process problem that can be fixed — not random bad luck.

4. Average Reimbursement per Episode

Average reimbursement per episode shows whether what you are actually paid lines up with what you expect based on your case mix and contracts.

If actual reimbursement is consistently lower than projected, it often signals coding, documentation, or utilization issues that are quietly costing you on every episode — not just the ones that get denied. Tracking this KPI helps you protect margin without adding more visits or volume.

5. Aging AR Over 90 Days

Aging AR over 90 days is the percentage of your outstanding receivables that have been unpaid for more than 90 days. The longer a claim sits in this bucket, the less likely you are to ever collect it.

Reviewing this aging category every month — instead of discovering it during a year-end clean-up — gives you time to intervene while collection is still realistic, whether that means escalating with payers, correcting errors, or writing off uncollectible balances in a timely way.

None of these numbers are especially powerful in isolation. The real value comes from tracking all five KPIs consistently and watching the trend lines, not just a single snapshot. Agencies that review these metrics monthly are usually the ones that catch a billing problem in week three instead of month three — and protect their cash flow in the process.. Context: This is for a blog post about "How to Read Sentences and Imagine the Best Possible Image". Style: Professional quality, photorealistic, high resolution

5 Billing KPIs Every Home Health Agency Should Track

Most home health agencies know their revenue matters — but far fewer track the specific billing KPIs that explain why revenue is higher or lower than expected. These metrics turn a vague sense of “cash flow feels tight” into something you can actually diagnose, monitor, and fix.

1. Clean Claim Rate

Clean claim rate is the percentage of claims that are accepted and paid on the first submission, with no rejections, edits, or corrections required. A healthy clean claim rate is typically above 90%.

If your rate is lower, it usually points to upstream problems such as incomplete documentation, missing authorizations, or coding errors — not just a billing department issue. Improving this metric puts cash in the door faster and reduces rework for your team.

2. Days in Accounts Receivable (AR)

Days in AR measures how long, on average, it takes to collect payment after a claim is submitted. Think of it as the “speed” of your revenue cycle.

When days in AR starts creeping up, it is often the earliest warning sign of a billing bottleneck — long before it shows up as a cash shortage. Watching this trend monthly helps you spot payer delays, follow-up gaps, or process slowdowns early.

3. Denial Rate

Denial rate is the percentage of claims that are denied on first submission. For home health agencies, a denial rate consistently above 5–10% deserves a closer look.

The real power comes from breaking denials down by reason and by payer. If most denials trace back to one insurer, one discipline, or one documentation gap, you are looking at a process problem that can be fixed — not random bad luck.

4. Average Reimbursement per Episode

Average reimbursement per episode shows whether what you are actually paid lines up with what you expect based on your case mix and contracts.

If actual reimbursement is consistently lower than projected, it often signals coding, documentation, or utilization issues that are quietly costing you on every episode — not just the ones that get denied. Tracking this KPI helps you protect margin without adding more visits or volume.

5. Aging AR Over 90 Days

Aging AR over 90 days is the percentage of your outstanding receivables that have been unpaid for more than 90 days. The longer a claim sits in this bucket, the less likely you are to ever collect it.

Reviewing this aging category every month — instead of discovering it during a year-end clean-up — gives you time to intervene while collection is still realistic, whether that means escalating with payers, correcting errors, or writing off uncollectible balances in a timely way.

None of these numbers are especially powerful in isolation. The real value comes from tracking all five KPIs consistently and watching the trend lines, not just a single snapshot. Agencies that review these metrics monthly are usually the ones that catch a billing problem in week three instead of month three — and protect their cash flow in the process.

blog author avatar

DAY Home Health Solutions

Day Home Health Solutions provides expert healthcare case management, QAPI reviews, and compliance support to help agencies deliver high-quality patient care and streamline operations.

LinkedIn logo icon
Back to Blog